Observed evidence · Dragon Lake Parking Dataset
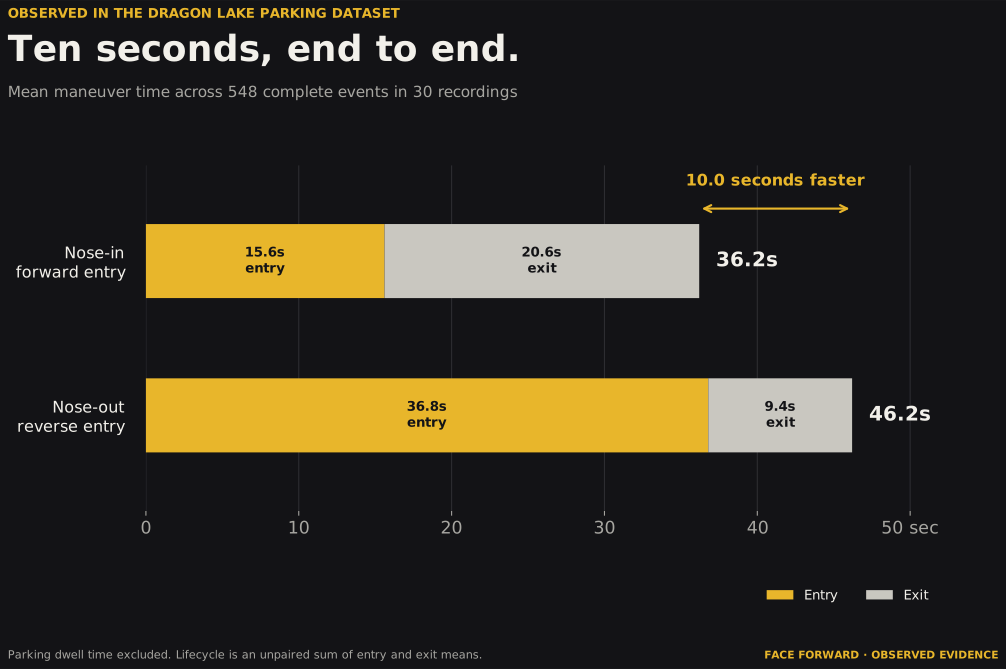
Ten seconds, end to end.
Across 548 complete parking and unparking events, nose-in parking averaged 36.2 seconds across entry and exit. Reverse-entry / nose-out parking averaged 46.2 seconds. In these recordings, the simpler lifecycle was also the faster one.
The setting is the Dragon Lake lot: a roughly 140 × 80 m surface lot of about 400 spaces, recorded from a drone by UC Berkeley’s MPC Lab. Stall geometry comes from the dataset’s published parking map (nine lettered areas, A–I).
548
complete events
30
recordings
10.0 s
observed difference
99.53%
bootstrap draws beyond 2 s
The trade-off
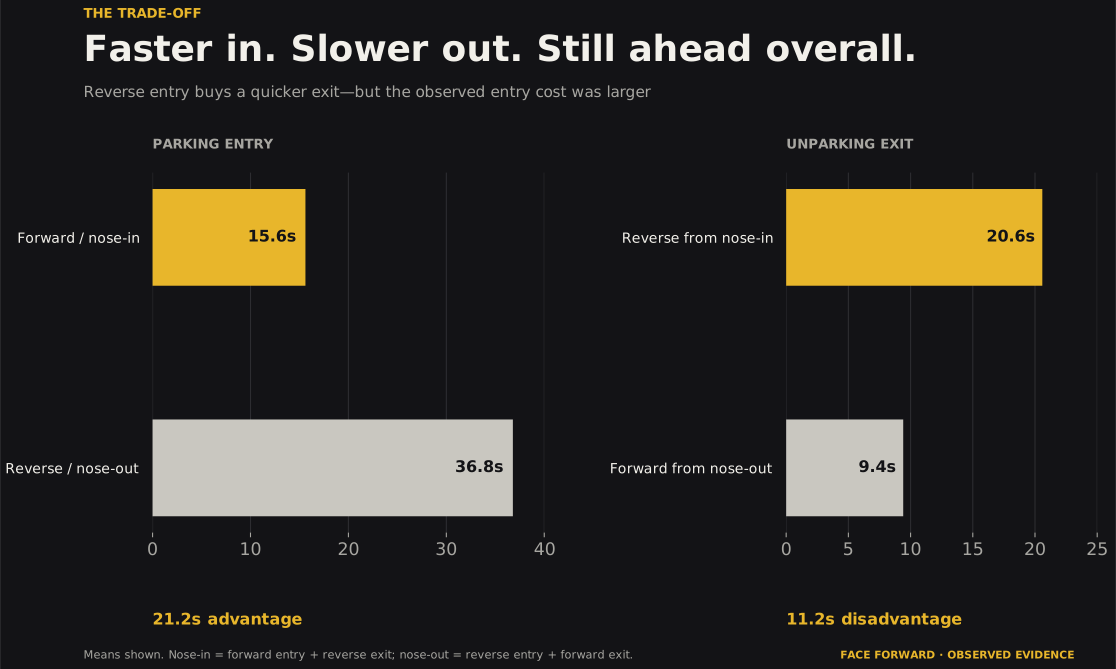
Faster in. Slower out. Still ahead overall.
Reverse-entry parking has a real advantage: leaving forward was 11.2 seconds faster than reversing out. But reverse entry itself took 21.2 seconds longer. In this dataset, the extra time spent backing into the stall was not recovered on departure.
Robustness
A signal that survives reasonable pressure.
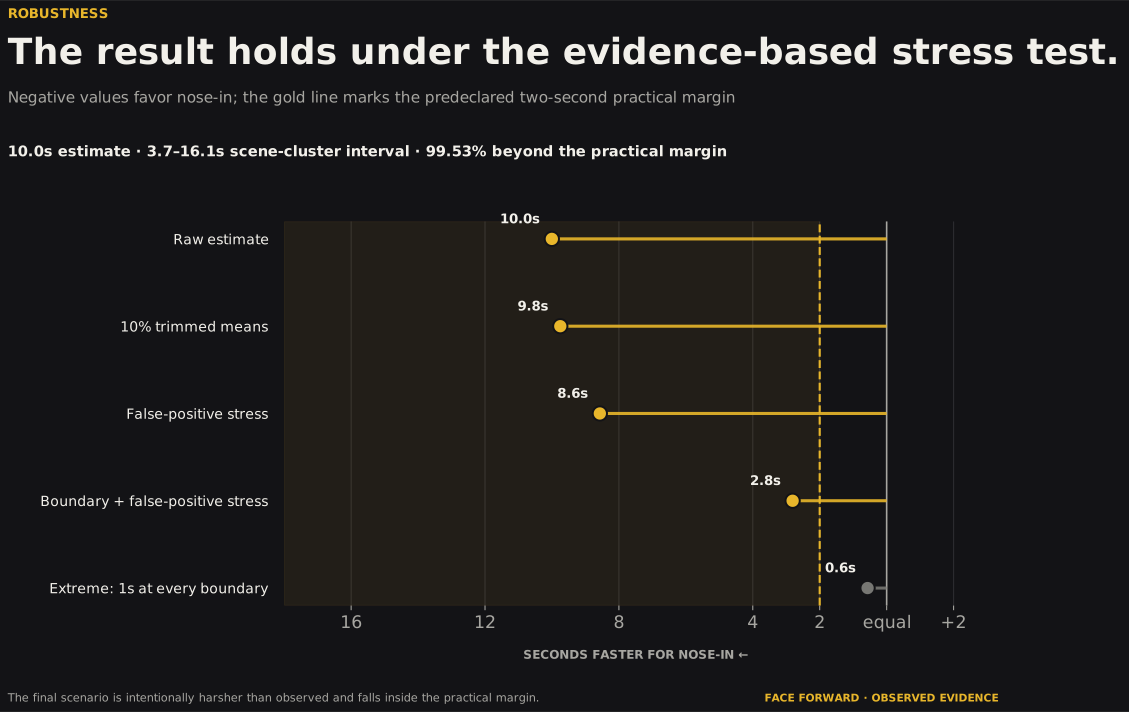
The 10% trimmed estimate was 9.8 seconds. A 10,000-draw scene-cluster bootstrap placed the difference between 3.7 and 16.1 seconds. Even after an adverse false-positive adjustment and the observed boundary errors, nose-in remained 2.8 seconds faster, beyond the two-second practical margin set before the comparison.
What the data supports
A defensible observed result.
In the Dragon Lake recordings, nose-in parking had the faster unpaired maneuver lifecycle. The direction was stable under trimming, scene resampling, and the evidence-based detector stress test. That makes the result useful evidence for a simple proposition: driving directly into a stall can save time overall, even after accounting for a slower reverse departure.
What it does not claim
One dataset is not every parking lot.
This study does not establish causation, universalize one lot to every setting, or measure safety, visibility, pedestrian conflict, courtesy, or parking quality. The lifecycle combines observed entry and exit means rather than pairing the same driver’s arrival and departure.
How events were bounded
Boundaries, stated plainly.
A parking event starts at the first committed deviation from aisle travel: a sustained turn toward the stall, or the first sustained deceleration from cruise speed, within the 8 m envelope around the stall. It ends at the confirmed parked state, speed below 0.05 m/s inside the stall for at least two seconds. An unparking event starts at the first sustained movement above 0.25 m/s and ends when the vehicle rejoins aisle travel above 0.75 m/s.
For reverse entry, the measured window includes the positioning that precedes the reverse: pulling past the stall, stopping, and any correction before backing in. Applying identical boundary rules to both entry styles guarantees parity; the nose-in advantage survives even intentional boundary stress-testing. Shifting every event boundary by the observed median errors, all in the direction least favorable to nose-in, still leaves a 4.2-second advantage.
Full validation notes
We set a 95% broad event-precision target and observed 92.2%. Recall was 100%, method accuracy was 95.5%, and median boundary error was 0.56 seconds. Real maneuvers are not always clear-cut, and the detector did not meet every predeclared promotion threshold.
The timing analysis excludes the censored boundary candidates responsible for most broad false positives. Within the complete detector-positive strata actually used here, held-out weighted precision was 98.0% (31 of 32 reviewed items were real events). We report both figures rather than substituting the narrower estimate for the original gate.
The deliberately extreme sensitivity case (a full second at every boundary, always assigned against nose-in) falls inside the practical margin. The central estimate should therefore be read as a strong observed association, not a universal precision claim.
How the study was made
From a parking opinion to an observed result.
The original simulation helped frame the question. The published result comes from recorded vehicle trajectories, a deterministic event detector, blinded human review, and a deliberately bounded set of robustness checks.
01 · Ask one measurable question
Compare total entry-and-exit maneuver time for forward-entry / nose-in and reverse-entry / nose-out parking.
02 · Work from observed trajectories
Process all 30 Dragon Lake Parking recordings and identify complete parking and unparking events across the published stall geometry.
03 · Validate without revealing predictions
Use a held-out, blinded review package to test event recognition, maneuver classification, and timing boundaries before the aggregate analysis.
04 · Try to move the answer
Recalculate with scene-cluster resampling, trimmed estimates, and deliberately adverse boundary assumptions. Report what changes, and what does not.
This four-step account is the project’s concise methodology overview. The chart pack, summary data, source dataset, and analysis code below provide the supporting record.